Search This Blog

Saturday, February 1, 2014

Most Successful Strategies for Ninjatrader

Most Successful Strategies for Ninjatrader

Our Most Useful and Flexible Setups are :
  • EMA ( trending setup )
  • SRS ( trend and counter trend setup )
  • Reversal ( counter trend setup ) ...currently available only on semi automatic mode

The SRS Setup is covered on these links :

On this link you will learn How it Works : The Indicator Store: Small Range Setup
( on this early version it was used as a trending system )
Later I explained how to use it on counter trend mode : SRS for Trend and Counter Trend Setups

This video is about the Semi Automatic Indicator ( PMS_SRS ) 
...that allows to trade the Setup from Chart Trader using ATM Orders : PMS_SRS_v6 - YouTube
And this is my last Ninja Webinar were I explains the basics of the Setup : NinjaTrader Partner Presentations - 3/20/2013 - YouTube
Powerpoint used in the Ninja Webinar : Link

The Reversal Setup is covered on these links :

It is an overbought/oversold indicator that uses stochastics to predict possible Market Reversals
The logic is explained on this Post : Selling Tops and Buying Lows on Ninjatrader
The Automated version is shown on this Post : PMS_Reversal System for Ninjatrader Upgrade
This link has a video about the PMS version ( semi/full automatic )
This is the link to the powerpoint used on the Ninja Webinar Ninja Webinar Link

The EMA Setup is covered on these links :
The EMA setup uses 2 indicators ; 
You can find info about this setup on the following posts :
If you feel comfortable with this Trending Setup, you can choose one of our dedicated packages ;
With TIS_EMA you can do visual backtests, and also get real time alert and entry price indications
With PM_EMA you can automate the setup, generate backtests and optimizations.
With PMS_EMA it is possible to auto trade the setup with user control of the trade ; we can allow/avoid next trade and also move the orders. The system enters the market using our preferred ATM Order Management andthe releases the control to us.

Don't forget to follow me on G+ and check my trades :  G+

Some examples on last trades :
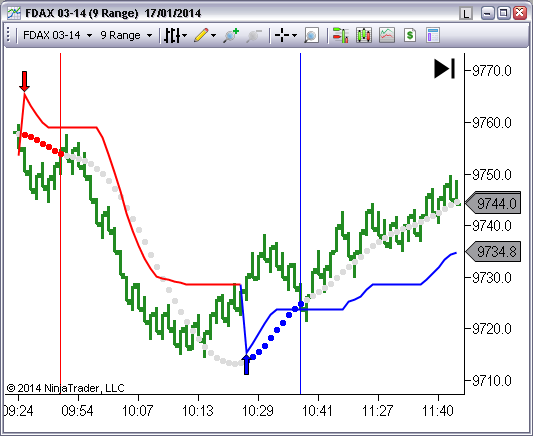
  • This is a Reversal ( Green Dot ) overlapping an SRS ( Cyan Diamond ) Long : LINK
  • This Short is an SRS Signal ( Orange Diamond ) : LINK
  • This is an EMA entry ( Red dotted line ) Short : LINK
  • We can see 2 short reversal signals ( red dots ) and 2 long reversal signals ( green dots ) : LINK
Let me know if you have any question...

Best Regards,
Pablo

logo Pablo Maglio The Indicator Store 

Facebook Twitter LinkedIn Blogger Elance  G+  YouTube

Automated Strategies for Ninjatrader

Hello Traders !

On this article we are going to review all our trade setups that have a Strategy for Ninjatrader fully automated and can be back tested, optimized and traded live.

This is a list of all those ordered in function of its low complexity ;
  1. EMA ( it trades an Exponential Moving Average ; Read More )
  2. Bouncer ( it is an anti EMA ; as it trades against it )
  3. Vwap ( it trades the Volume Weighted Average Price )
  4. SRS ( Custom Setup ; Read More )
  5. ATR_BarColor
  6. Impulse
  7. High Low Crossover

On this setup we only need to optimize a pair of parameters ;
  • The period of a Moving Average
  • The size of an envelope
The size of the envelope is slightly lower than the stop we are planning to use, so we can focus on finding the Period

This is an example using the Optimizer to scan Moving Averages on ES, looking for a 1.5 points of target against 2 points of Stop :


Depending on the level of the commisions, then we have a few areas with good moving averages to trade with.

This is an example of the equity curve using an EMA(166) :


Now we can optimize all other settings trying to obtain a better shaped equity curve ;


This systems trades agains the PM_EMA, so we can use the same PnL vs Period Chart, and trade the worst performing moving averages. It works better on non trending, but more volatile markets like Crude Oil or Gold

3) PM_VWAP
Similar logic used by PM_EMA, but replacing the moving average by the vwap.
Something interesting about the vwap is that it produces the same result on any timeframe, so this setup is almost not related to time frame. The only impact changing the time frame is the possibility of taking more trades over same entry.

This is a system that uses an envelope, a moving average and a donchian channel to define the trend and entry logic.
It can be configured with or against the trend. (Read More)

This is an optimized report example on CL using a Range 9 Bar Chart taking into account last 2 months ( Dec 2013 and January 2014 )


5)PM_ATR_BarColor

UNDER CONSTRUCTION

Best Regards,
Pablo

logo 
Pablo Maglio The Indicator Store 

Facebook Twitter LinkedIn Blogger Elance  G+  YouTube

Saturday, January 18, 2014

Supertrend Setup for Ninjatrader

Hello everyone !

Most of you may already know the Supertrend Indicator, it has been available for most platforms including Ninjatrader.
There are several versions, some of them free and including different calculation modes.
It is basically a trend detection systems very useful also for trailing stop management purposes.
On the following chart we can see the trend changes indicated by arrows when the line is calculated with the default settings ; an HMA(14) and a multiplier of 2.618

and on the following chart, the HMA is changed by the Median ;

Using an SMA :

Same SMA, but changing the multiplier from 2.618 to 1

As we can see, this is a very flexible and powerful indicator to define trend and reversals.
If we are in the Market, the indicator can be used to keep the trailing stop slightly below its line.
If we are looking for an Entry, once a trend change is detected ( red and blue arrows are painted ) we have several options :
  • Enter at Market
  • Wait for a pullback with a Limit Order Entry
If we decide to use the pullback entry option, then we need to define How to Calculate the Entry.

A suggested approach is using same line study used for the supertrend but with a slower period.
Lets review the SMA example where the supertrend is calculated with an SMA(8) and a multiplier of 2.618.
Now we add an SMA(17) ( dotted line ) and we have a complete trade setup :
Once we have a trend change ( arrow ) we place a limit order at the SMA.
On the following chart we can see a short at red dotted line and then a long at blue dotted line.
Entry time bars are marked with vertical lines :

Another example with HMA : supertrend with HMA(10) and Entry with HMA(50)

How to Manage the Trade

It is evident that this system will get the best results on impulsive and trending markets when we use runners.
When holding a position and using a trailing stop, at some time the trend will lose impulse and there will be a reversal.
For example, on the following Chart we can see a long filled after 4 or 5 bars of the arrow up :
If our trailing stop is big enough to survive all the way up and then we get a red arrow down we have several options ;
  • Close the long after a red down arrow is painted
  • Leave the position alone being managed by its trailing stop
  • Reverse the Long Position at New Short Entry ( red dots ) assuming the long trailing stop is not triggered.
On The Indicator Store we have a Custom TIS_Supertrend Indicator with all the User defined settings to define the Trend and also a user defined Entry as shown on previous Chart.

If you like the Supertrend possible Setups using the rules explained, it can be automated by Markers ; a Semi Automatic and also Full Automatic System that trades all possible trade setups described. 
It has the option of Early Exit; in case we are holding a position, and an inverse arrow ( trend change ) is painted we can decide if closing actual position or not.
If we decide not using early exit, then the current position will be exited at trailing stop or reversed at new entry.

Let me know if you have any question or suggestion...
Best Regards,
Pablo

Sunday, January 5, 2014

Polynomial Regression Channel Analysis for Ninjatrader

Hello Traders,

The topic for today is the PRC ( Polynomial Regression Channel ).

What is, and how can be used the PRC ?

There are hundreds of sites, mostly mathematical sites where we can get a lot of info about it.

This is a brief summary :

When we have a series of data points ( price bars ) and we want to find a formula that best fits all points of the analyzed data set, we can use a linear regression :

Where Y = a.X + b
( picture from wikipedia )
Linear regression.svg

and it represent all the data points by a straight line.

This is the more elemental and easy to calculate... but with more error.

If we increase the degree of the polynomial to 2, then we get a parabola ;
Where Y = a.X2 + b.X + c
( charts generated with arachnoid page )

This kind of polynomial is always predicting a turning point ( polynomials with odd degree ( 1, 3, 5, etc ) will have the starting point and ending point with same trend )

So, for trading analysis, most people use degree = 3

On the following examples, I am using bigger samples ; 128 data points ( bars )
The PRC line is the gray dot-dashed line, and then I add two Bollinger bands. And the space between them is painted to create a zone:

On this CL 5 Minutes Chart we can see a 1 degree ( straight line ) polynomial calculated over the last 128 bars.


This is a 5 Minutes Gold Chart using a grade 3 polynomial :

So, selecting a big enough sample size and using a 3 degree optimized polynomial, we can create accurate trading zones that we can use on our daily trading.

We can use the PRC approach to any time frame, even a quick tick chart.
But I suggest using more slow and widely used charts, in the range of 5 Minutes or even higher. The most people looking and trading those levels, the better it will work...

On this example, we can see a 150 Ticks Gold Chart, using the levels provided from the 5 Min 3rd degree PRC ( previous chart )


Using the custom Indicator Pack TIS_PRC_OT from The Indicator Store we get the Basic PRC Indicator and its Muti Time Frame Version.

We can apply the TIS_PRC_OT indicator to any of our work charts, any time frame ( range, tick , volume, etc )...it will always calculate the levels from the user defined time frame ( shown in the red box ). By default I use 5 Minutes, but again, we can select any time frame, even non standard types.

One important factor that must be taken into account ;
All the data points of the sample ( 128 on last examples ) are recalculated at each new sample.
That means that the PRC analysis repaints.
This is one of the reasons why it is suggested to use high time frame PRC's to define the levels and use them into a quick day trading chart, where we can get a target in an insignificant number of samples ( bars ) of the original Chart were the PRC was calculated.

Hope this information has been useful for you...
Please let me know if you have any questions...


Best Regards,
Pablo

logo Pablo Maglio The Indicator Store 

Facebook Twitter LinkedIn Blogger Elance  G+  YouTube

Thursday, January 2, 2014

Semi Automatic Systems for Ninjatrader - January 2014

Hello Traders,

Following our plans to upgrade all our PMS Systems to the last version, as shown on PMS_Reversal System for Ninjatrader Upgrade

We are prod to announce that our 3 Setups ; EMA, SRS and Reversal are upgraded to the last version including Position Management and Money Management.

About the PMS Systems
The PMS Systems are an integration of a Setup Indicator and an Entry Technique.
As we know, Ninja do NOT allow to use Chart Trader on a Chart were we have a strategy applied...
To solve that issue, we developed the PMS Systems ; that integrates an indicator and a strategy...

The indicator is applied to the Chart, and it calculates all the trade Setup and Entry Price.

Once the Indicator ( PMS_SRS, PMS_EMA or PMS_Reversal ) is applied to the Chart, we get the following toolbar, with indications of the name of the Setup ( EMA on this example ), Enable Next Long , Enable Next Short and the name of the ATM to be used on Orders.

The Strategy ( with same name as the Indicator ) is applied to Control Center Strategy Tab, not to the chart, so we can use Chart Trader.
The indicator send Entry Price Info to the strategy, and it convert them to orders to be sent to the exchange.
The Orders can then be moved and managed by the user without affecting the strategy.

All the settings are defined in the Indicator. The strategy has no parameters other than the Instrument to trade, and the Account were to send the Orders.

The current version of PMS on all our Setups now include these settings :
  • ATM_Name : default name of ATM. Can be changed from the toolbar
  • Manual Mode : If Long button is enabled, after a fill it gets disabled, so we need to press it again for a new trade. If manual mode is set to false, the button status will remain unchanged after a fill
  • MM_Max_Daily_Loss : It is a negative value. If Daily Loss is equal or greater, the system will not take more trades
  • MM_Max_Daily_Profit : It is a positive value. If Daily Profit is equal or greater, the system will not take more trades
  • Position Manage : If we get a signal while being in the Market we have 4 options : 1=do nothing, 2=Enter New trade, 3=Close current Position, 4=Reverse (default and suggested)
  • Show_PnL : Show Current Daily PnL and Last Trade Result

Please let me know if you have any question...

Best Regards,
Pablo

logo Pablo Maglio The Indicator Store 

Facebook Twitter LinkedIn Blogger Elance  G+  YouTube